Microbial Enhanced Oil Recovery

Note: This post was modified from a term project report which is submitted in partial fulfillment of the requirement of an Enhanced Oil Recovery course in 2008. In this report, a brief history of Microbial Enhanced Oil Recovery (MEOR), current status of MEOR, classification of MEOR, research areas, microorganisms for MEOR, advantages and disadvantages of MEOR, and screening criteria of MEOR were summarized.

1. Introduction

Enhanced Oil Recovery (EOR)

Discoveries of new reservoirs, is a high-risk business that companies undertake hoping to achieve a correspondingly high return. Sometimes they are successful but more often they are not. In many cases, increasing the recovery of oil from existing reservoirs can be less expensive than exploration and less risky as well. The reservoir will have already been partially developed therefore wells and surface production facilities are already in place1.

Oil Recovery

Oil Recovery Factor: also called overall hydrocarbon displacement efficiency, the volume of hydrocarbon displaced divided by the volume of hydrocarbon in place at the start of the process measured at the same conditions of pressure and temperature.

Recovery Factor=\frac{G_{p}}{OGIP}

R=E_{D}E_{V}

Where,

Ev= macroscopic (volumetric) displacement efficiency; and

ED= microscopic (volumetric) hydrocarbon displacement efficiency.

Microbial Enhanced Oil Recovery

Microbial enhanced oil recovery refers to the use of microorganisms to retrieve additional oil from existing wells, thereby enhancing the petroleum production of an oil reservoir. In this technique, microorganisms are introduced into oil wells to produce harmless by-products, such as slippery natural substances or gases, all of which help propel oil out of the well. Because these processes help to mobilize the oil and facilitate oil flow, they allow a greater amount to be recovered from the well2.

Mechanisms of MEOR

The use of microorganisms and their metabolic products to enhance oil production involves the injection of selected microorganisms into the reservoir and the subsequent stimulation and transportation of their in-situ growth products in order that their presence will aid in further reduction of residual oil left in the reservoir after secondary recovery is exhausted. The MEOR is unlikely to replace conventional EOR methods, because MEOR itself has certain constraints. This unique process seems superior in many respects, however, because self-duplicating units, namely the bacteria cells, are injected into the reservoir and by their in-situ multiplication they magnify their beneficial effects3. Some of the mechanisms proposed by which these microbial agents could stimulate oil release are shown in Table 1.

Table 1. Microbial products & their contribution to EOR4

2. History of Microbial Enhanced Oil Recovery

First Stage: Initial (~1975)

In 1895,Miyoshi first reported the growth of a mould culture on n-alkanes5. In 1926, Bastin did the first extensive microbiological study describing the widespread presence of SRB in oil-producing wells6. At the same year, Beckman suggested that microorganisms could be used to release oil from porous media7. Later in 1946, as the most important founder of MEOR, ZoBell patented a process for the secondary recovery of petroleum, using anaerobic, hydrocarbon-utilizing, sulfate-reducing bacteria such as Desulfovibrio species in situ8. The first field test was carried out in the Lisbon field, Union County, AR in 19549. Kuznetsov et al. found that bacteria discovered in some oil reservoirs in the Soviet Union produced 2 gm of CO2 per day per ton of rock, in 196310.

Second Stage: Developmental (1975~1996)

From 1970s to late 1990s, MEOR research was boosted by the petroleum crisis and later became a scientific substantiated EOR method. Many international meetings were periodically organized on the MEOR topic and proceedings volumes with the advances in the knowledge and practice of MEOR have been published. Several books on MEOR were also published4.

Third Stage: Rapid (1996~)

From late 1990s, modern biological methods began to be applied on the MEOR research, such as Molecular Ecological Technique of Microbes, Protoplast Fusant Technology, and Recombination DNA Technology11,1 2.

3. Current Status of MEOR

The research of MEOR has been done worldwide, and most of oil produce countries have applied this technology into oil fields for pilot tests. Recently this technology has been widely used in oilfields of China, such as Daqing, Shengli, Jilin, Dagang, Liaohe, Henan, Changqing, Xinjiang, and Qinghai.

4. Classification of MEOR

Mainly, MEOR is classified as surface MEOR and underground MEOR based on the place where microorganisms work. For surface MEOR, biosurfactand (Rhamnolipid13), biopolymer (xanthan gum14), and enzyme15 are produced in the surface facilities. These biological products are injected into the target place in the reservoirs as chemical EOR methods. While, for underground MEOR, microorganisms, nutrients and/or other addictives are injected into the reservoir and let them sustain, grow, metabolize, and ferment underground.

Based on the source of microorganisms, underground MEOR is categorized into in-situ MEOR and indigenous MEOR. While according to procedures of processes, underground MEOR is sorted as:

  • Cyclic Microbial Recovery (Huff and Puff, Single Well Stimulation)
  • Wax Removal and Paraffin Inhibition (Wellbore Cleanup)
  • Microbial Flooding Recovery
  • Selective Plugging Recovery
  • Acidizing/Fracturing

a. Cyclic Microbial Recovery

A solution of microorganisms and nutrients is introduced into an oil reservoir during injection. The injector is then shut in for an incubation period allowing the microorganisms to produce carbon dioxide gas and surfactants that help to mobilize the oil. The well is then opened and oil and products resulting from the treatment are produce. This process may be repeated. Fig.1 illustrates this technology.

Fig.1 Illustration of Cyclic Microbial Recovery16

b. Microbial Flooding Recovery

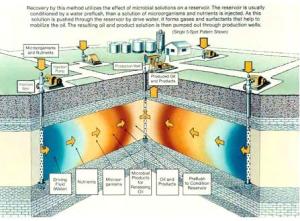
Recovery by this method utilizes the effect of microbial solutions on a reservoir. The reservoir is usually conditioned by a water preflush, then a solution of microorganisms and nutrients is injected. As this solution is pushed through the reservoir by drive water, it forms gases and surfactants that help to mobilize the oil. The resulting oil and product solution is then pumped out through production wells. Fig.2 diagrammatized this technology as below.

Fig.2 Illustration of Microbial Flooding Recovery16

c. Selective Plugging Recovery

Injection of bacterial suspensions followed by nutrients to produce biopolymer and microbial itself, which may plug the high permeability zone in the reservoir. The reduction of permeability would change the inject profile and achieve conformance control. Fig.3 schemed this technology.

Fig.3 Illustration of Selecting Plugging Recovery3

5. Research Areas

From the above introduction, the research areas of MEOR could be concluded as history, geology, chemistry, microbiology, fluid mechanics, petroleum engineering, genetic engineering, chemical engineering, geotechnical engineering, environmental engineering, mechanisms of MEOR, transportation of bacteria, industrial participation, information technology, and economics. That requires education, cooperation between historian, geologist, chemist, microbiologist, production engineer, reservoir engineer, geotechnical engineer, environmental engineer, accountant, finance manager, information technologist, mathematician, and others.

6. Microorganisms for MEOR

a. Characteristics of Bacteria16

1) Dynamic ecology with many species

2) Growth determined by environment

i. Nutrients: cell material and energy

ii. Physical

iii. Chemical

iv. Biological

b. The microorganisms for MEOR should have the following potential properties:

  • Small Size
  • Resistant to High Temperatures
  • Resistant against High Pressure
  • Capability of Withstand Brine and Seawater
  • Anaerobic Using of Nutrients
  • Unfastidious Nutritional requirements
  • Appropriate Biochemical Construction for Production Suitable Amounts of MEOR Chemicals
  • Lack of any Undesirable Characteristics

Here, undesirable characteristics mean permeability reduction (damage the formation where a large amount of remaining exist), corrosion, and souring.

7. Advantages and Disadvantages of MEOR

a. Advantages of MEOR4

  • The injected bacteria and nutrient are inexpensive and easy to obtain and handle in the field
  • Economically attractive for marginally producing oil fields; a suitable alternative before the abandonment of marginal wells
  • According to a statistical evaluation (1995 in U.S.), 81% of all MEOR projects demonstrated a positive incremental increase in oil production and no decrease in oil production as a result of MEOR processes
  • The implementation of the process needs only minor modifications of the existing field facilities
  • The costs of the injected fluids are not dependent on oil prices
  • MEOR processes are particularly suited for carbonate oil reservoirs where some EOR technologies cannot be applied with good efficiency
  • The effects of bacterial activity within the reservoir are magnified by their growth whole, while in EOR technologies the effects of the additives tend to decrease with time and distance
  • MEOR products are all biodegradable and will not be accumulated in the environment, so environmentally friendly

b. Disadvantages of MEOR17

  • Safety, Health, and Environment (SHE)
  • A better understanding of the mechanisms of MEOR
  • The abilibity of bacteria to plug reservoirs
  • Numerical simulations should be developed to guide the application of MEOR in fields
  • Lack of talents

8. Screening Criteria for MEOR

Table 2. Screening Criteria for MEOR by NIPER and RAMChemical18

9. Conclusions

a. Great achievements

MEOR has developed for decades. A series of fundamental research work has been done. Several pilot tests have been applied in the fields.

b. Promising EOR method

The success of research work and pilot tests makes this technology is attractive in the industry. This cost-effective method could contribute more in oil production, especially in mature oil fields.

c. Need more efforts

Since this technology has developed for a relatively long time, and has great achievements, to turn the promising into reality needs more efforts. The modern biological technology accelerates MEOR, which needs money and talents.

10.References

  1. Microbial Enhanced Oil Recovery (MEOR). Sajjadian, V.A., www.ripi.ir/lang/seminars/82-7-29/Sajjadian.pdf. Downloaded 22nd December 2008.
  2. Microbial Enhanced Oil Recovery. BioBasics, http://www.biobasics.gc.ca/english/View.asp?x=793. Downloaded 22nd December 2008.
  3. Donaldson, E.C., Chilingarian, G.V., and Yen, T.F. 1989. Development in Petroleum Science, 22: Microbial Enhanced Oil Recovery, 9. Amsterdam, Netherlands: Elsevier Science Publishers B.V..
  4. Lazar, I., Petrisor, I.G., and Yen, T.F. 2007. Microbial Enhanced Oil Recovery (MEOR). Petroleum Science and Technology 25 (11): 1353-1366.
  5. Miyoshi, M. 1895. Die durchbohrung von membranen durch pilzfäden. Jahrbücher für wissenschaftliche Botanik 28: 269–289.
  6. Bastin, E.S. 1926. The problem of the natural reduction of sulphates. AAPG Bulletin 10 (12): 1270–1299.
  7. Beckman, J.W. 1926. The Action of Bacteria on Mineral Oil. Industrial Engineering Chemical News, 4 (10):3.
  8. Zobell, C.E. 1946. Bacteriological Process for Treatment of Fluid-Bearing Earth Formations. U.S. Patent 2,413,278.
  9. Yarbrough, H. F., and Coty, F. V. 1983. Microbially enhancement oil recovery from the Upper Cretaceous Nacafoch formation Union County, Arkansas. Proceedings of 1982 International Conference on MEOR, Donaldson, E. C. and Benett Clark, J. B. (Eds.), Afton, Oklahoma: 149–153.
  10. Kuznetsov, S.I., Ivanov, M.V., and Lyalikova, N.N. 1963. Introduction to Geological Microbiology, 252. New York City: McGraw-Hill.
  11. Skovhus, T. L., Højris, B., Saunders, A.M., Thomsen, T.R., Agerbæk, M., and Larsen, J. 2007. Practical Use of New Microbiology Tools in Oil Production. Paper SPE 109104 presented Offshore Europe 2007, Aberdeen, Scotland, U.K. 4-7 September.
  12. Wu, Q., Zhang, Z., Yu, L, Huang, L, and Yang, P. 2007. Construction of a fusion bacterial strain and the profile control characteristics of it. Journal of Xi’an Shiyou University (Natural Science Edition), 22 (2): 41-44.
  13. Banat, I.M. 1995. Biosurfactants Production and Possible Uses in Microbial Enhanced Oil Recovery and Oil Pollution Remediation: A Review. Bioresource Technology 51 (1):1-12.
  14. G.P. Lindblom, D.G. Ortloff, and J.T. Patton. 1967. Displacement of Oil from Partially Depleted Reservoirs, U.S. Patent No. 3,305,016.
  15. Using enzymes to enhance oil recovery. SPE, http://updates.spe.org/index.php/2008/04/01/using-enzymes-to-enhance-oil-recovery/. Downloaded 22nd December 2008.
  16. Sheehy, A.J. 2008. Microbial Enhanced Oil Recovery New Strategies Improved Recovery www.spegcs.org/attachments/studygroups/9/FinalSPENorthside040808.pps. Downloaded 22nd December 2008.
  17. Sarkar, A.K., Goursaud, J.C., Sharma, M.M., and Georgiou, G. 1989. A Critical Evaluation of MEOR Processes. In Situ, 13 (4): 207-238.
  18. Bryant, R.S. 1991. MEOR Screening Criteria Fit 27% of US Oil Reservoirs. Oil & Gas Journal, 89 (15): 56-59.

Determination of Perforation and Production Strategy for Single Well with Aquifer using CMG

Note: This is the third project for the reservoir simulation course. A radial model has been used to simulate a single well with bottom aquifer. The perforation and production strategy were determined through the reservoir simulation.

Description of the Reservoir

A target petroleum production unit is given in this project. To construct a radial model, assume the outer radius is 200 m, and the thicknesses of three layers are 8 m, 8 m, and 4 m, respectively. The water-oil contact is  -3140 m; and the bubble point pressure is 10000 kPa. There is an aquifer that is 50 m thick connecting to the bottom of the production unit. The aquifer has the same permeability, 200 md, and porosity, 0.20, with all layers. Rock properties, relative permeability, and PVT data are the same as previous project, Comparing the Performance of 5-Spot and Inverted 9-Spot Patterns by Reservoir Simulation using CMG Suite. The aquifer is 2.5 larger than the reservoir. Figure 1 shows the simple model for production unit and aquifer.

Figure 1. A simple model for production unit and aquifer.

Parameters to determine the size of radial grids include:

  • Number of divisions alone radius direction: 15
  • Number of divisions alone theta direction: 5
  • Grid block width in radius direction: 3, 5, 8, 10, 10*15, 24

There is a production well in the center of the production unit, meaning the well location in the grid system is (1,1). The production started from January 1, 1995; the liquid production rate is 50 m3/day; all layers are perforated for production. Production well constraints are: min bottom hole pressure 1500 kPa and max liquid production rate as 100 m3/day for operation, and max water cut is .95 for monitor and shut-in conditions.

Tasks:

  • Water Cut

Put the simulation stop time card at Jan. 1, 2020, determine the date/time that water breaks, and water cut reaches 50, 60, 70, 80, 90 and 95%.

Dates of Water breaks, and water cut reaches 50, 60, 70, 80, 90 and 95% could be determined through Figure 2. Water Cut vs. Time Curve, and listed in Table 1.

Table 1. Water Cut vs. Time

Water Cut Water Break 50 60 70 80 90 95
Date 01/01/95 05/01/00 09/01/00 04/01/01 01/01/02 12/01/03 11/01/05

Fig. 2 Water Cut vs. Time Curve for Base Case

  • Perforation Strategy

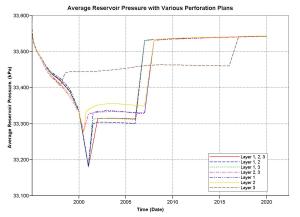
There are 7 perforation plans for base case, which are layer 1+2+3, layer 1+2, layer 1+3, layer 2+3, layer 1, layer 2, and layer 3, respectively. Figures 3-6 show the water cut curves, cumulative oil production, oil production rate, and average reservoir pressure with various perforation plans. The water cut curves could be separated in to three groups based on the time water cut reaches the peak and the shape of the curve:

  • Group 1, all the perforation plans including layer 1, such as layer 1+2+3, layer 1+2, layer 1+3, and layer 1;
  • Group 2, all the perforation plans including layer 2 but excluding layer 1, such as layer 2+3, and layer 2;
  • Group 3, layer 3 only.

Layer 1 dominates the water production in group 1, and layer 2 dominates the water production in group 2.

At early time, layer 1 only produced least water, while layer 3 only produced most. And Group 1 has shortest production history, and group 3 has longest production history. If only taking water cut account, perforating layer 3 only should be best. But, there are still something others we need to consider, such as recovery, oil production rate, and average reservoir pressure, etc.

From Fig. 4, the cumulative oil production curve, layer 1 only could produce the most oil (130.54 MS m3), while layer 3 only could produce the least (128. 36 MS m3). The, the choice should be layer 1 only. Figures 4 and 5 confirm this suggestion. Layer 1 has the longest stable oil production rate with 50 m3 per day.

Fig. 3 Water Cut with Various Perforation Plans

Fig. 4 Cumulative Oil Production vs. Time with Various Perforation Plans

Fig. 5 Oil Production Rate vs. Time with Various Perforation Plans

Fig. 6 Average Reservoir Pressure with Various Perforation Plans

  • Critical Production Rate

To find an optimum or critical production rate, 4 more production rates have been tried, such as 30, 40, 50, 60, 70 m3 per day. Figures 6-9 show the water cut curves, cumulative oil production, oil production rate, and average reservoir pressure with various production rates.

Figures 7, 9, and 10 show that the less production rate, the longer oil produced, and the slower average pressure dropped. Those three figures could not tell which production rate is the best one, while Fig. 8, the cumulative oil production could. The pink curve which represents the oil production rate at 60 m3 per day is higher than any other, which is 130.98 MS m3.

Fig. 7 Water Cut with Various Production Rates

Fig. 8 Average Reservoir Pressure with Various Production Rates

Fig. 9 Oil Production Rate vs. Time

Fig. 10 Average Reservoir Pressure with Various Production Rates

  • Effects of Permeability Anisotropic Ratios

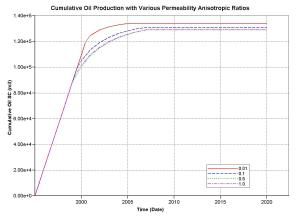
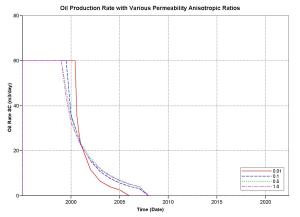
To find out the effect of permeability anisotropic ratios (kv/kh) on the performance of the well, 3 more ratios have been tried, such as 0.01, 0.5, and 1.0. Figures 10-13 show the water cut curves, cumulative oil production, oil production rate, and average reservoir pressure with various permeability anisotropic ratios.

All the figures show that the performance of permeability anisotropic ratio being 0.01 is significantly from those other three. At early time of production, the higher permeability anisotropic ratio, the earlier water breaks and the higher water cut is (Fig. 11). Since for the case that permeability anisotropic ratio is 0.01, the water break very late and water cut is lower than others at early time, water cut increases very fast, and reached the limitation fastest. At late time of production, there is no difference between 0.1, 0.5, and 1.0. From Figs. 13 and 14, the case that permeability anisotropic ratio is 0.01 has the longest stable production time, and lowest average reservoir pressure, because no cross flow exists. The permeability anisotropic ratio of 0.01 means fluid can only flow in horizontal direction, and pressure can effectively drive the fluid flow through the reservoir rock. That could be confirmed by the cumulative oil production data showed on Fig. 12 and Table 3.

Fig. 11 Water Cut with Various Permeability Anisotropic Ratios

Fig. 12 Cumulative Oil Production with Various Permeability Anisotropic Ratios

Fig. 13 Oil Production Rate with Various Permeability Anisotropic Ratios

Fig. 14 Average Reservoir Pressure with Various Permeability Anisotropic Ratios

Table 3. Cumulative Oil Production and Recovery with Various Permeability Anisotropic Ratios

Parameters Permeability Anisotropic Ratio
0.01 0.1 0.5 1.0
Cumulative Oil Production (MS m3) 133.92 130.98 129.08 128.99
Recovery (%) 44.377 43.400 41.430 42.743

Summary

  1. Perforating Layer 1 only and the liquid production rate is set up at 60 m3 per day is the optimum production plan.
  2. Lower permeability anisotropic ratio has better performance due to less cross flow.

Comparing the Performance of 5-Spot and Inverted 9-Spot Patterns by Reservoir Simulation using CMG Suite (Cont~)

RESULTS

1. Recovery and Cumulative Oil Production

The difference of reservoir fluids recovery for 5-spot and inverted 9-spot patterns from simulation results is listed in Table 4, and the cumulative oil production could be found from Fig. 3.

Table 4. Recovery for 5-Spot and Inverted 9-Spot Patterns

Parameters 5-Spot Pattern Inverted 9-Spot Pattern

Percentage Recovery

(%)

Oil 42.128 41.148
STO as a % of Mobile Oil 83.011 81.080
Total Gas 93.901 93.280
Water -214.84 -246.91

From the simulation results, the recovery of oil, Stock Tank Oil (STO) as a percentage of mobile oil, and total gas for 5-spot pattern is higher than inverted 9-spot pattern, and less water injection is needed.

Fig. 3 Cumulative Oil Production for 5- and Inverted 9-Spot Patterns

2. Water Cut

The filed water cut for 5-spot and inverted 9-spot patterns from reservoir simulation are shown in Fig.4.

Fig. 4 Field Water Cut for 5- and Inverted 9-Spot Patterns

The water cut curve for inverted 9-spot pattern has two peaks, one in the year of 2003 and the other in the year of 2005, while the water cut curve for 5-spot pattern has only one peak in the year of 2019.

To understand the difference between field water cut curves for two patterns, it is better to investigate the well water cut curves for two patterns in Fig. 5.

Fig. 5 Well Water Cut for 5- and Inverted 9-Spot Patterns

In Fig. 5, well water cut curves of producers for the two patterns could be found. The pink and blue curves represent Well 1 and Well 4, the two diagnosed producers for inverted 9-spot pattern, both of which reached the water cut of 0.95 in the year of 2003. After that, due to the constraints, Well 1 and Well 4 shut in, while Well 3 continued producing until the year of 2005. After the three producers reached the water cut limit, the filed production stopped. As for well water cut curve of Well 1 for 5-spot pattern, the peak occurred in the year of 2019.

For water cut curve of 5-spot pattern, after it reached the peak, it did not turn to zero instantly, which is different from others. Double check with the output file, on Dec. 29, 2019, there is no oil or water produced, and the water cut should be zero. The curve shows 20% water cut on Jan. 1, 2020. The paradox between the data and curve is still not understandable, maybe a numerical solution error.

As for this concept petroleum production unit, 5-spot pattern could produce more oil and gas, but inject less water, comparing with inverted 9-spot pattern.

In addition, whether 5-spot pattern or inverted 9-spot pattern could only produced no more than 45% of oil by water flooding for such a homogeneous reservoir, if proper EOR methods used, such as polymer flooding, the recovery should be increased at 10% more or less.

3. Average Reservoir Pressure, Liquid and Oil Production Rate

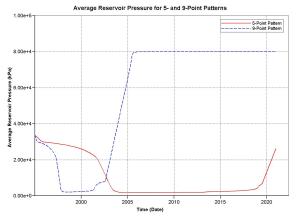
Because the oil production rate is highly dependent on the reservoir pressure, the average reservoir pressure, liquid and oil production rate data are combined in Fig. 6.

Fig. 6 Average Reservoir Pressure and Oil Rate for 5- and Inverted 9-Spot Patterns

From the initial conditions and constraints, the initial reservoir pressure is around 34000 k Pa, and the bubble point pressure is 30000 k Pa, while the maximum bottom hole pressure is 80000 k Pa, thus, the injection started on Jan. 1, 1995 for both cases. At this phase, the major mechanism for oil production is depletion. Each producer has a constant oil rate which is 30 m3 per day, with high gas rate. With the reservoir pressure decreases, more and more solution gas came out. After produced two years (the year of 1997), the solution gas rate reached the peak, and the reservoir pressure could not provide enough energy for oil rate at such a high level for inverted 9-spot pattern, the oil rate dropped very quickly. Then, water flooding supported the oil production. Until the year of 2001, only oil produced comparing the liquid rate and oil rate. Afterwards, the oil rate decreased and liquid rate increased very quickly. If we checked the water cut in Fig. 3 or 4, we could found that water cut increased sharply. When the two producers reached 0.95 water cut, they were shut in. The oil rate and liquid rate lowered to 30 m3 per day until the water cut reaches the upper limit. Once the three producers were shut in, the reservoir pressure will maintain at 80000 k Pa, the upper limit for the injection.

As for 5-spot pattern, after produced eight years (the year of 2003), the solution gas rate reached the peak, and the reservoir pressure could not provide enough energy for oil rate at such a high, the oil rate dropped very quickly. Then, water flooding supported the oil production. Until the year of 2004, only oil produced comparing the liquid rate and oil rate. Afterwards, the oil rate decreased and liquid rate increased very quickly. If we checked the water cut in Fig. 4 or 5, we could found that water cut increased sharply. When the producer reached 0.95 water cut, it will be shut in.

Comparing the two cases, inverted 9-spot pattern could be regarded as the compressed 5-spot pattern on the time scale. If we stretched the pressure curve of inverted 9-spot pattern, the curve may match that of 5-spot pattern.

4. Gas-Oil Ratio

Figure 7 shows the gas oil ratio changes with time. The curves prove the production history explained above.

Fig. 7 Gas Oil Ratio for 5- and Inverted 9-Spot Patterns

5. Oil Saturation Distribution

Figures 8 and 9 provide the oil saturation on Jan. 1, 1997, and on Jan. 1, 2017, respectively. According to the scale bar on the right of the figures, dark green shows lower oil saturation, and light green (or yellow) shows high oil saturation. The difference of oil saturation between layers could show the gravity effect on the water flooding.

Fig. 8 Oil Saturation for 5-Spot Pattern on Jan. 1, 1997

Fig. 9 Oil Saturation for 5-Spot Pattern on Jan. 1, 2017

CONCLUSIONS

From the simulation results, we can conclude that

  1. For this reservoir, 5-spot pattern has higher recovery, but inverted 9-spot pattern produces oil more efficiently;
  2. Inverted 9-spot pattern seems to be the compressed 5-spot pattern due to the high injection rate;
  3. A decision should be made if more conditions provided;
  4. From the PVT data and relative permeability data, this reservoir is homogeneous, but the mobility ratio became more and more unfavorable, inverted 9-spot pattern should be considered;
  5. The oil saturation distribution shows the gravity effect during water flooding;
  6. Whether 5-spot pattern or inverted 9-spot pattern could only produced no more than 45% of oil by water flooding for such a homogeneous reservoir, if proper EOR methods used, such as polymer flooding, the recovery should be increased at 10% more or less.

Reference:

  1. Rose, S.C., J.F. Buckwalter and R.J. Woodhall, “The Design Engineering Aspects of Waterflooding”, SPE Volume 11 of the Henry L. Doherty Series, Richardson, TX (1989).

APPENDIX

Mobility Ratio:

M=\frac{\left ( \frac{k_{r}}{\mu } \right )_{w}}{\left ( \frac{k_{r}}{\mu } \right )_{o}}=\frac{ \frac{k_{rw}}{\mu_{w}}}{ \frac{k_{ro}}{\mu_{o}}}=\frac{ \frac{\mu_{o}}{\mu_{w}}}{ \frac{k_{ro}}{k_{rw}}}

Comparing the Performance of 5-Spot and Inverted 9-Spot Patterns by Reservoir Simulation using CMG Suite

Note: Reservoir simulation is a must for a petroleum engineer. During the past 10 years, I focus on experimental studies of EOR processes. I have been waiting for a formal training on reservoir simulation for years. This spring, our PE program opens a course on reservoir simulation using CMG suite, which is easy for a beginner, and has a special component STARS to simulate the enhanced oil recovery processes, especially conformance control using superabsorbent polymer (also called “preformed particle gel” in literatures). In this post and the next, I will show the CMG reservoir simulation results to compare the performance of 5-spot and inverted 9-spot patterns using black oil model, which is part of team project for that reservoir simulation course.

INTRODUCTION

The objective is to study and compare the performance of five-point and nine-point patterns. The tasks included are:

  1. Construct models for a reservoir model with five-spot and inverted nine-spot patterns using CMG;
  2. Run reservoir simulations for both models;
  3. Compare the simulation results by Dec. 31, 2020 for recovery, water cut, average reservoir pressure, oil production rate, gas-oil ratio, cumulative oil production, oil saturation, and pressure distribution between 5-spot and inverted 9-spot patterns.

RESERVOIR DESCRIPTION

A conceptual petroleum production unit with 400 m*400 m*20 m in size is to be simulated. The unit is approximated into 20 * 20 regular grids in horizontal layers and each cell is 20 m in length; and 3 layers in the vertical direction (as 8m, 8m, and 4m respectively).

The grid top, grid thickness, porosity, and permeability in x, y, and z directions are listed in Table 1.

Table 1. Reservoir Properties

Grid Top

(m)

Grid Thickness

(m)

Porosity

(fraction)

Kx

(mD)

Ky

(mD)

kz

(mD)

3120 8 0.2 200 200 20
3128 8 0.2 200 200 20
3138 4 0.2 200 200 20

Some other information about the reservoirs could be found below:

  • Rock Compressibility: 6e-7 1/k Pa, Reference Pressure: 1379 k Pa
  • Reference Pressure: 34000 k Pa @Reference Depth: 3170 m
  • Constant Bubble Spot Pressure: 30000 k Pa
  • Water-Oil Contact: 3250 m
  • Gas-Oil Contact: 2990 m

Black-oil model is chosen, and PVT data is listed in Table 2 and relative permeability is listed in Table 3.

Table 2. PVT Data for Reservoir Fluids in Conceptual Petroleum Production Unit

MODEL BLACKOIL

PVT EG 1

**$

p        Rs        Bo        Eg      viso      visg

700       6.8     1.121      5.77      1.11   0.01262

1600     17.29     1.173     12.41      0.96   0.01349

2270     21.85     1.179     17.08      0.95   0.01371

3160     26.91     1.182     23.98      0.88   0.01401

4640     33.99     1.214     35.33      0.83   0.01434

6430     41.66     1.217     48.84      0.79   0.01485

8500     52.16     1.245     65.49      0.74   0.01535

12490     70.89     1.295     96.05       0.7   0.01657

17280     93.19     1.343    132.78      0.59   0.01849

20960    107.78     1.386    159.54      0.54    0.0204

34470    201.68      1.49    257.76       0.3   0.02741

48260    359.65     1.596    357.98      0.23   0.03456

68950    596.61     1.755    613.66       0.2   0.05281

DENSITY OIL 830.0

DENSITY GAS 1.330

DENSITY WATER 1153.0

CO 1.1360e-6

CVO 3.0120e-5

BWI 1.01

CW 4.3510e-7

REFPW 102.0

VWI 1.290

CVW 0.0

**$ Property: PVT Type  Max: 1  Min: 1

PTYPE CON            1

Table 3. Relative Permeability Data for Conceptual Petroleum Production Unit

*SWT

**

SW     KRW    KROW    PCOW

0.200  0.0000  1.0000  195.84

0.229  0.0001  0.7407   95.20

0.255  0.0003  0.6829   60.00

0.308  0.0012  0.5722   22.00

0.334  0.0023  0.5194   18.80

0.412  0.0102  0.3715   12.60

0.464  0.0219  0.1526    8.43

0.557  0.0416  0.0822    4.40

0.606  0.0721  0.0000    1.32

0.647  0.1448  0.0000    0.00

0.700  0.1780  0.0000    0.00

0.800  0.2604  0.0000    0.00

1.000  1.0000  0.0000    0.00

*SLT

**

SL     KRG    KROG    PCOG

0.200  1.0000  0.0000 3891.60

0.316  0.6784  0.0000  579.60

0.435  0.6215  0.0000  372.40

0.562  0.5456  0.0000  242.50

0.614  0.3939  0.0020   60.80

0.702  0.1399  0.0280   37.21

0.812  0.0515  0.1721   13.65

0.875  0.0297  0.3395   10.45

0.906  0.0226  0.4395    9.00

0.937  0.0173  0.5500    7.51

0.969  0.0131  0.6702    5.90

1.000  0.0000  1.0000    0.00

BASIC MODEL SETUP

Based on the reservoir conditions, a black oil model with 20*20*3 grid blocks are created by Builder, a CMG component. Each grid block in layer 1 (top layer) and layer 2 (mid layer) is 20 m* 20 m*8 m, and each grid block in layer 3 (bottom layer) is 20 m* 20 m*4 m.

FIVE-SPOT PATTERN

Injector (Well-2) and producer (Well-1) are defined in the diagnosed corner cells in Fig. 1, the grid top model for five-spot pattern. The producer started working on Jan. 1, 1995 at liquid production rate is 30 m3 per day. The water injection rate is 30 m3 per day. Layers 1, 2, and 3 are perforated for both producer and injector. Constraints for producer are: minimum bottom hole pressure as 1500 k Pa and maximum liquid production rate as 100 m3/day for operation, and maximum water cut is 0.95 for monitor and shut-in conditions; and constraints for injector are: maximum bottom hole pressure is 80000 k Pa, and maximum water injection is 2000 m3/day for operation.

Fig. 1 Grid Top Model for Five-Spot Pattern

INVERTED NINE-SPOT PATTERN

Injector (Well-2) and one producer (Well-3) are defined in the diagnosed corner cells, and another two producers (Well-1, 4) are defined in another two diagnosed corner cells at phase 90 degrees in Fig. 2, the grid top model for inverted nine-spot pattern.

The producer started working on Jan. 1, 1995 at liquid production rate is 30 m3 per day. The water injection rate is 90 m3 per day. Layers 1, 2, and 3 are perforated for both producer and injector; and well constraints are same with five-point pattern.

Fig. 2 Grid Top Model for Inverted Nine-Spot Pattern

(to be continued)